Zero Waste and New York's Climate Footprint
Maggie Clarke, Ph.D.
Maggie Clarke Environmental
1795 Riverside Drive, #5F
New York, NY 10034
Abstract: Amid the pages of ideas and ambitious
proposals to move New York toward sustainability in the City’s long term
environmental sustainability plan: PlaNYC for 2030, solid waste is not sufficiently
addressed. Even though solid waste has a
huge environmental impact, PlaNYC misses the opportunity to reduce greenhouse
gas emissions by having a serious goal of working towards zero waste. Other forward-thinking countries, states and
communities have already set a goal of zero waste and are aggressively
implementing programs, legislation and incentives to achieve it. Associated with PlaNYC is a calculation of
New York City’s carbon footprint, which again ignores some important impacts of
solid waste on greenhouse gas emissions, zeroing out any contribution to carbon
footprint of products and packaging imported into the City or impacts of
recycling. This paper discusses the
carbon footprint calculation methodology used by New York City and the
potential of zero waste in New York City’s long range planning, as described in
“Reaching for Zero – the Citizens’ Plan for Zero Waste in New York City.
Keywords:
zero waste,
carbon footprint, sustainability, environmental planning, New York City, climate,
GHG, greenhouse gases, waste prevention, recycling, reuse, waste.
Introduction
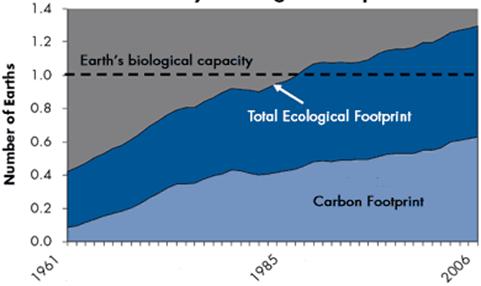
Global climate change is one of humanity’s greatest challenges and one of the most important indicators that we are in ecological overshoot. Since the carbon footprint is 50 percent of humanity’s overall Ecological Footprint, reducing our carbon footprint is essential to ending ecological overshoot.
|
Today, the term “carbon footprint” is being used as shorthand for the amount of carbon (usually in tons) being emitted by an activity or organization. The carbon component of the Ecological Footprint goes beyond this definition and translates this amount of carbon dioxide into the amount of forest area required to sequester carbon dioxide emissions. This tells us the demand on the planet that results from burning fossil fuels. [1] |
Fig 1. Humanity’s Ecological Footprint
|
New York City’s Carbon Footprint
In 2007 New York City (NYC) introduced a long-range a comprehensive sustainability plan for the City’s future, PlaNYC for 2030. PlaNYC puts forth a strategy to reduce the City’s greenhouse gas footprint, while also accommodating a population growth of nearly one million, and improving the city’s infrastructure and environment, including a million new trees. New York City has set the goal of reducing its citywide carbon emissions by 30% below 2005 levels. Utilizing the ICLEI Local Governments for Sustainability methodology[2] for calculating greenhouse gases on a municipal level, and their framework for setting and meeting climate mitigation goals, the City’s annual Greenhouse Gas Emissions Inventory will track progress towards the goal.[3] New York is one of 750 cities participating internationally in the ICLEI Cities for Climate Protection campaign, including 240 U.S. cities.
The first inventory showed that NYC residents produce 7.1 Metric tons of carbon dioxide equivalent (CO2e) per capita, only 29% of the national average per capita greenhouse footprint.[4] Almost all the footprint is emissions from buildings or vehicles.
Fig 2. GreeNYC
|
However, due to what appears to be a major flaw in the methodology, the City is not assuming any responsibility for the greenhouse gases produced because of its demand and importation of all materials (products, packaging, fuels) or to quantify recycling and reuse impacts. As far as the City is concerned, the responsibility for the greenhouse gases emitted as a result of the demand for products, materials, and packaging by city residents and businesses is spread |
Figure 3. Time Series of NYC CO2e emissions by
sector, 1995, 2000, 2005
|
out in the little towns and big cities that supply and manufacture things for import. Under this methodology, logging, mining, refining, and manufacturing towns which primarily export would have a large greenhouse footprint, totally disproportionate to their populations. Figure 3 from the City’s first inventory shows solid waste management’s contribution to the footprint as 3% in 1995 and zero in 2000 and 2005. This 3% was for disposal in the City’s Fresh Kills landfill; the facility closed in 2001. All other impacts from export and non-city disposal of waste and recyclables was zero. [5]
The 2007 inventory says citywide emissions have increased by about eight percent in the last 10 years, and are on trend to increase 25 percent above 2005 levels by 2030. The inventory also found that actions taken by the city from 1995 to 2006 resulted in the avoided emission of 446,000 metric tons of CO2e per year. The past actions include an agreement between the city and the New York Power Authority that provides financing for energy efficiency projects in city buildings, the use of alternative fuel vehicles in the city's fleet, landfill methane recovery, and the conversion of traffic signals to LEDs.
|
Because the majority of New York’s solid waste is disposed of in managed landfills, and because it is assumed that landfills accepting New York’s waste are estimated to capture 75 percent of the methane that is generated through the anaerobic decomposition of the organic matter in waste, disposal of this waste resulted in net CO2e emissions of approximately -1.5 million metric tons in 2005. When emissions from this source are included with solid waste emissions, the net total is -1.2 million metric tons. |
Figure 4. CO2e emissions from NYC solid waste 2005 [6]
Methane capture in landfills results in net negative emissions due to continued carbon sequestration. |
Future plans to further reduce CO2e emissions include the switch
from truck to barge and rail for the hauling of solid waste out of the city as
part of the Solid Waste Management Program enacted in 2005. [7]
Carbon
Footprint Methodologies
There are two main approaches to greenhouse gas inventories: geographic and corporate. Geographic inventories measure greenhouse gas emissions that originate within a defined geographic boundary. A standard protocol for geographic inventories for nations has been developed as part of the United Nations Framework Convention on Climate Change, but no such standard protocol exists for geographic inventories for cities. Following the national protocol in developing local geographic inventories is challenging to assess the carbon footprint for a city because the area is much smaller and because cities function within regional and national economies. Some activities that have significant greenhouse gas emissions associated with them – such as seaports, airports, freeways, and industrial plants – may exist within city boundaries but serve a much larger area and population. Conversely, the climate pollution associated with many in-city activities, such as electricity generation and solid waste disposal, occurs outside of the city’s boundaries.
By contrast, corporate inventories aim to measure the greenhouse gas emissions of an organization and its facilities and operations, regardless of their geographic location. Protocols for corporate inventories were developed by the World Business Council for Sustainable Development, the World Resources Institute and the California Climate Action Registry. Neither of these two standard protocols -- one for nations and the other for corporate entities -- is a perfect fit for assessing the carbon footprint of a local community.
NYC’s
methodology: ICLEI
New York City has adopted a standard methodology for carbon footprint assessments on the local level, developed by ICLEI – Local Governments for Sustainability. A concurrent partnership effort between ICLEI, the Clinton Climate Initiative and Microsoft is developing a software tool to work with this emerging protocol.[8]
ICLEI’s
Five Milestones are a simple, standardized means of calculating greenhouse gas
emissions, of establishing targets to lower emissions, of reducing greenhouse
gas emissions and of monitoring, measuring and reporting performance. ICLEI has
developed a software tool, Clean Air Climate Protection (CACP), that helps
cities comply with the methodology.
1.
Conduct a baseline emissions inventory and forecast
This inventory and forecast provide a benchmark for planning and monitoring
progress.
2. Adopt an emissions
reduction target for the forecast year
A city resolution creates a framework that guides the planning and
implementation of measures.
3. Develop a Local Climate
Action Plan
The local government develops this Plan, ideally with robust public input from
all stakeholders. detailing the policies and measures that the local government
will take to reduce greenhouse gas emissions and achieve its emissions
reduction target. Most plans include a timeline, a description of financing
mechanisms, and an assignment of responsibility to departments and staff. Most plans also incorporate public awareness
and education efforts.
4. Implement policies and
measures
The city implements the policies and measures contained in their Local Climate
Action Plan.
5. Monitor and verify results
Monitoring begins once measures are implemented and continues for the life of
the measures.[9]
The ICLEI methodology included the following scopes for purposes of classification of emissions:
Scope 1: All direct greenhouse gas (GHG) emissions (with the exception of direct CO2 emissions from biomass combustion).
Scope 2: Indirect GHG emissions associated with the consumption of purchased or acquired electricity, steam, heating, or cooling.
Scope
3: All other indirect emissions not covered in Scope 2, such as upstream
and downstream emissions, emissions resulting from the extraction and
production of purchased materials and fuels, transport related activities in
vehicles not owned or controlled by the reporting entity (e.g., employee
commuting and business travel), outsourced activities, waste disposal,
etc. ICLEI guidance allows flexibility
in the assignment of CO2e emissions into scopes. New York City chose
for CO2e from long-haul export of municipal solid waste to remain
Scope 1 emissions to allow the significant expected reduction in CO2e
from implementation of the City’s Solid Waste Management Plan (SWMP) to be
reflected as a reduction below the base year inventory.
ICLEI’s first protocol stated that there are four sources of emissions from waste management that a local government must include in the carbon footprint analysis (although sources 1 and 2 may not exist in every community):
1. “Emissions from solid waste disposal landfills/open dumps inside of the community’s geopolitical borders (Scope 1)
2. Emissions from incineration/open burning and composting/biological treatment inside of the community’s geopolitical borders (Scope 1)
3. Emissions from solid waste generated by the community and disposed of at landfills/open dumps regardless of the location of the facility (Scope 3)
4. Emissions from solid waste generated by the community and disposed of by
incineration/open burning and composting/biological treatment regardless of the location of the facility (Scope 3)” [10]
The 2008 NYC
Greenhouse Inventory [11]
To accurately quantify GHG emissions levels, the City
revised portions of its analysis methodologies from those used in the base year
inventory. In revising its methodologies, the City followed the guidance of the
draft International Local Government GHG Emissions Analysis Protocol,
being developed by Local Governments for Sustainability (ICLEI), and the draft Local
Government Operations Protocol, being developed by ICLEI, the California
Air Resources Board, and the California Climate Action Registry, in
collaboration with The Climate Registry.
The guidance in these two protocols resulted in two major
changes in the City’s methodology: CO2e emissions from solid waste
exported from the city were considered Scope 3 emissions (not included in total
levels) and fugitive methane emissions from in-city landfills were added to
both the citywide and City government analyses.
In
the original analysis, all CO2e emissions generated from solid waste
sent to in-city landfills were assumed to be emitted in the year of
disposal—even though the actual emission of CO2e may not occur for
many years. Also, solid waste from organic matter was assumed to be sequestered
in the landfill, resulting in a carbon sink.
|
Following
ICLEI’s guidance, the City is now measuring the emissions from previously
disposed solid waste in in-city landfills each year over the life of the
gas. New York’s landfills (i.e., Fresh
Kills, Edgemere, the Brookfield Avenue, Fountain Avenue, Pelham Bay, and
Pennsylvania Avenue landfills) no longer accept the disposal of solid waste. Additionally, the waste coefficient was revised to exclude the sequestration of |
Figure 5 Emission of
Methane Landfills over time [12] |
|
|
|
carbon
for waste disposed of in out-of-city landfills (resulting in a positive CO2e
value for exported solid waste for both citywide and City government analyses). CO2e emissions from in-city landfills are
considered Scope 1 emissions, and counted toward the City’s total inventories,
while emissions from landfills outside the city that receive city solid waste
were considered to be Scope 3 and are not included in the City’s inventories. [13]
|
FY2006 Government adjusted CO2e emissions by sector now show landfill methane to be 4% of the total 4.07 MMT. Other adjustments included assignment of emissions from waste presently disposed of in landfills as Scope 3 emissions and inclusion of fugitive methane emissions from the City landfills in the base year inventory. [14] |
Table 1. NYC CO2e Emissions MT/yr 2005-2007
|
The ICLEI methodology appears not to count the GHG impacts of trucking of waste to landfills and incinerators out-of-state as well as the pluses and minuses of recycling operations. Reuse and reduction programs and initiatives are also not fully accounted for. The impacts from transportation of products and packaging to the City, is also left off the ledger. As of the current time frame, the City generates about 12,000 tons per day of recyclables and refuse. Recycling diversion ranges from 16 to 18% with a capture rate for designated recyclables under 50%. [15] There is no zero waste goal in NYC’s long-range solid waste management plan. Manhattan’s unrecycled discards go to the Newark incinerator and much of the rest of NYC’s exported waste goes to out-of-state landfills, many in Pennsylvania and western New York state, hundreds of miles away. But New York City’s carbon footprint methodology focuses on perfecting landfill methane emission figures.
Zero Waste, Energy savings,
and Greenhouse Gas Reductions
|
USEPA
made the link between solid waste management and greenhouse gas emissions
several years ago [16]
and illustrates the waste lifecycle with all the major opportunities for
emissions and reductions of greenhouse gases (see figure 6). [17] Recycling, waste prevention and product redesign
save energy and reduce carbon emissions. Wasting materials causes massive amounts of
energy to be used to extract and manufacture natural resource |
Figure 6. EPA’s Lifecycle of Waste Schematic Diagram
|
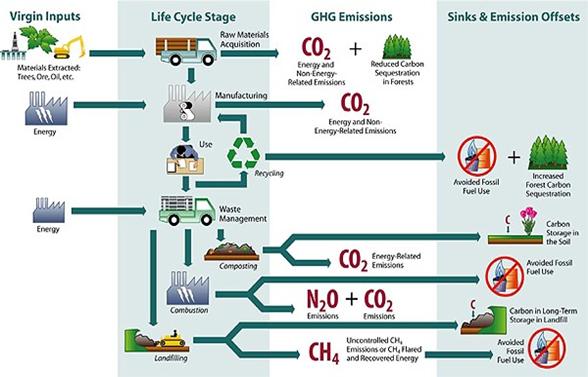
replacement
materials. Reducing material use through
waste prevention and increasing
material efficiency through product
redesign have the greatest beneficial impact on climate change. Recycling
adds further to greenhouse gas savings by reducing the need for
energy-intensive resource extraction.
See Table 2.
Table 2. GHG Emissions of MSW
Management Options Compared to Landfilling (MT CO2e/ton) [18]
The U.S. Environmental Protection Agency provides an example for reducing carbon footprint:
At
the community level, a city of 100,000 with average waste generation (4.5
lbs/day per capita), recycling (30 percent), and baseline disposal in a
landfill with no gas collection system could increase its recycling rate to 40
percent—for example, by implementing a pay-as-you-throw program—and reduce
emissions by more than 3,400 MTCE per year. (Note that further growth in
recycling would be possible; some communities already are exceeding recycling
rates of 50 percent). [19]
“Recycling reduces emissions by
3.2 to 5.1 tonnes CO2e per tonne recycled and composting reduces
emissions by 1.1 tonnes CO2e per tonne composted. [20] Manufacturing using recycled rather than
virgin material also saves substantial energy in virtually every case. [21]
Making a ton of aluminum cans from its
virgin source, bauxite, uses 229 British thermal units (Btus). In contrast,
producing cans from recycled aluminum uses only 8 Btus per ton, an energy
savings of 96%.” [22]
The waste stream has leveled off in waste generated per
capita (figure 7), but because the population of the country keeps growing, the
waste stream continues to grow.
Therefore, carbon emissions also grow.
Growth in recycling is slowing down too (figure 8), and is pretty much
keeping pace with growth in generation. So
there is potential for reductions in GHG emissions by preventing waste and
recycling more.
|
|
|
Figures 7 and 8. USEPA data on waste generation and recycling [23]
“For every ton of municipal trash, about 71 tons of waste are produced during manufacturing, mining, oil and gas exploration, agriculture and coal combustion. This requires a constant flow of resources to be pulled out of the Earth, processed in factories, shipped around the world, and burned or buried in our communities.” At each step, energy is consumed and greenhouse gases are released into the atmosphere. Wasting equals climate change. “Using the U.S. EPA's Waste Reduction Model (WARM) to estimate greenhouse gas reduction, the Zero Waste Approach - as compared to the business-as-usual approach - would reduce greenhouse gases by an estimated 406 megatons CO2e per year by 2030. This reduction of 406 megatons of CO2e per year is equivalent to removing 21 percent of the nation's 417 coal-fired power plants. This puts the 3Rs - reduce, reuse, recycle, along with composting - in the same league as other leading climate protection proposals such as improving national vehicle fuel efficiency, retrofitting lighting and protecting forests[24] (See Table 3.)
Table 3. Greenhouse
Gas Abatement Strategies: Zero Waste path Compared to Commonly Considered
Options (annual reductions in greenhouse gas emissions by 2030, megatons CO2e) [25]
The Zero Waste Movement
A
growing international Zero
Waste Movement is calling for radical resource efficiency and eliminating
rather than managing waste – strategies that have major benefits for slowing
climate change. There are zero emission cars and zero accident worksites. Zero Waste is a goal for how we should
responsibly manage materials and the energy required to make them. Zero Waste is a 'whole system' approach to
resource management that maximizes recycling, minimizes waste, reduces
consumption and ensures that products are made to be reused, repaired or
recycled back into nature or the marketplace. [26]
Zero Waste is a worldwide movement. Governments who have embraced it include New Zealand, Oregon, Minnesota, Seattle, Canberra, San Francisco, and Toronto. California already has over 50% diversion rate. Zero waste businesses include Apple Computer, Epson, HP, Pillsbury, Vons – Safeway, Anheuser-Busch, Fetzer Vineyards, and Mad River Brewery. Most of these have over 90% diversion from landfill.
Zero
Waste systems reduce greenhouse gases by saving energy, reducing energy
consumption associated with extracting, processing and transporting ‘virgin’
raw materials, manufacturing with recycled materials uses less energy overall
compared with manufacturing using virgin materials, increasing carbon uptake by
forests (recycled paper leaves more trees standing so
they can take up CO2), and reducing and eventually eliminating the
need for landfills (which release methane and CO2) and incinerators
(which waste energy relative to recycling and reuse). [27]
Zero waste in NYC
The City's 2030 plan ignores the lifecycle impacts and greenhouse gases we cause to generate outside of NYC, focusing only on what is emitted within NYC's borders. If people create the demand and the emissions, likewise, they can practice conservation measures and reduce these emissions. The state's Solid Waste Management Act of 1988 put waste prevention at the top of the hierarchy of preferred alternatives for a reason (that it is the most sustainable, environmentally desirable option). Reuse, recycling, and composting are also near the top of preferred methodologies. Waste export is not even in the hierarchy or the Act, but the City exports at a rate of 83%, “waste” that consists, predominantly, of compostable organics, recyclables, and products and packaging that could have been repaired, reused, or never consumed in the first place.
The City's long-term solid waste management plan does not reduce waste generation or seek to reuse materials in NYC much, and is only tentative in addressing most of the organics fraction of the waste stream, which is upwards of 40%. An exhaustive alternative plan of 200 pages was written by citizens in 2004 detailing how New York City can move towards zero waste over the next 20 years. [28] Milestones, concrete steps, and intermediate goals and methods to achieve zero waste for all waste sectors- residential, institutional and commercial by 2024, were delineated. Specific reuse, recycling, composting infrastructure and associated local economic development recommendations were made, methods to improve recycling and prevention education and enforcement were emphasized, and the report contained specific legislative and research & development initiatives.
If the City were to assume the responsibility for the
materials demand of its own citizens and the environmental impacts caused by
that demand, the policy implications would require that the City take a much
more bold approach in seriously pursuing a myriad of materials conservation
measures that are not contemplated in its 2030 goals (or its solid waste
management plan).
Recommendations
1.
Add a commitment to PlanYC and the solid waste
management plan to ensure deliberate movement away from export, landfilling and
incineration towards achieving zero waste disposal by 2030. Through the Urban
Environmental Accords, 103 city mayors worldwide have committed to sending zero
waste to landfills and incinerators by the year 2040 or earlier. A zero waste
approach is one of the fastest, cheapest, and most effective strategies we can
use to protect the climate and the environment. Implementing waste reduction
and materials recovery strategies nationally are essential to put us on the
path to stabilizing the climate by 2050. [29]
2. Fix the City's inventory document so that the City's demand for material resources is acknowledged as a source of greenhouse gases generated throughout the lifecycle of extraction, logging, refining, production, transportation, use, landfilling and incineration beyond the City’s borders.
3. Fix the City's solid waste management plan so that it envisions a deliberate movement towards zero waste by 2030 and adopts the measures recommended in "Reaching for Zero": the Citizens' Plan for Zero Waste in New York City.
4.
Phase out the practice
of landfilling and incinerating biodegradable materials such as food scraps,
paper products, and yard trimmings immediately. Composting these materials is
critical to protecting our climate and restoring our soils.
5.
Supply the funding necessary to adopt the zero
waste measures, expand climate change mitigation
strategies such as waste reduction, reuse, recycling, composting, and extended
producer responsibility, and achieve the intermediate and final
goals. Too often worthy goals are unattained or discarded because of the
lack of adequate funding.
References